TL;DR Brand trackers tell you where you stand. They cannot tell you what's actually driving it - or which lever, if moved, would change the outcome you care about.
- Most brand investment decisions are made by closing weak scores - but weak scores often have near-zero impact on volume, premium, or growth. The fix-the-gaps instinct is usually wrong.
- Path analysis maps which perceptions actually drive commercial outcomes. It runs on pooled respondent-level data across tracker waves - not wave averages - so it can reveal how individual perceptions relate to each other.
- Total effect matters more than direct effect. A perception pillar that looks moderate in isolation can be the most powerful driver once indirect routes through other pillars are counted.
- The output is a simulator: rank your levers by predicted commercial return before budget is committed, validate after 12 months. That is the difference between brand investment and brand spend.
- Understanding causality also enables deliberate halo effects - designing campaigns to move multiple perceptions at once - and using existing strong equity to build new adjacent perceptions.
Your brand tracking report arrives. Quality up 2 points. Consideration flat. Awareness down 1 point. Trust up 3 points.
The room knows what happens next. Someone says the quality improvement is encouraging. Someone else points out that consideration has not moved. Someone asks whether the trust number is real or noise. The brand manager pulls up last quarter's report to compare. Thirty minutes later, the conversation has produced a list of hypotheses with no way to choose between them - and no basis for deciding where the next budget cycle should go.
Tracker scores describe your position. They do not explain the causal structure underneath it. Without that structure, every quarterly review is an invitation to build a far-fetched hypothesis and act on it.
Tracking Without Causality Is Not Brand Analysis
A brand tracker gives you scores. It tells you where you stand on quality, trust, modernity, and value for money - and how those compare to competitors and to last quarter. What it does not give you is the map of how those perceptions relate to each other, or which ones, if moved, would actually shift the commercial outcome you care about.
A two-point shift on a monthly tracker wave - typically 250-300 respondents - is often within the margin of error. Teams spend significant budget - agency fees, tracker subscriptions, reporting time - to monitor changes that are, in most quarters, statistical noise. The movements get presented in reviews, discussed in planning sessions, and used to justify decisions that were often made on other grounds entirely. But even when a score change is real, a tracker without a structural model cannot tell you whether it caused anything downstream.
Quality up 3 points: did that improve consideration? Did it support price premium? Did it move alongside trust, or independently? Without a model of how brand perceptions interrelate and connect to commercial outcomes, you cannot answer any of those questions from the data. You can only speculate, and speculation acted on repeatedly produces incoherent brand communication.
The Fix-the-Gaps Trap
The most expensive consequence of tracking without causality is not misreading quarterly noise. It is the systematic investment in the wrong attributes.
When brand teams do not have a causal model, the instinct is universal and understandable: fix the weaknesses. If quality scores 48 and competitors average 62, the brief becomes: "build quality perceptions." Media is bought, creative is produced, campaigns run. Two years later, quality is at 54. Consideration has not moved. Premium pricing is still challenged. The investment has not delivered.
In an illustrative brand equity analysis based on FMCG tracker studies, a mid-sized brand had been investing communication budget behind "modern and contemporary" and "high quality" perceptions for three campaign cycles - both attributes where the brand indexed weakly versus the category leader. Path analysis showed that the quality and modernity cluster carried a combined relative importance weight of roughly 0.11 to volume share predisposition. Negligible. Emotional warmth, familiarity, and "a brand that gets people like me" carried 0.54. The brand had been solving the wrong problem, at significant cost, based on the reasonable but incorrect assumption that closing a gap on a weak score would move a commercial outcome.
This pattern is not unusual. It is the default outcome of making brand investment decisions from tracker scores without a structural model. The attributes where a brand scores weakest are often the ones with the lowest causal weight on volume, premium, or growth. Fixing them produces score improvements that do not translate to commercial results - and generates the kind of "brand works are unmeasurable" scepticism that follows every budget review.
The solution is not better trackers. It is understanding causality: which perceptions drive commercial outcomes, with what coefficient, and through which pathways.
What Understanding Causality Makes Possible
Most brand teams enter a planning cycle knowing where their brand stands. A path model tells you something different: which perceptions actually drive the commercial outcome you care about, how strongly, and through which routes. That changes three things.
You can identify the true levers before committing to a direction. Run a simulation: moving the emotional warmth cluster by 5 percentage points in endorsement predicts a measurably larger lift in volume share predisposition than moving the modernity cluster by the same amount. You see this before a brief is written, not after a campaign has run. The simulation does not make decisions for you - but it replaces guesswork with a ranked view of where investment has the most headroom.
You can design for the halo effect deliberately. A campaign or product launch does not move one perception in isolation - it moves everything causally connected to it. Understanding the causal structure means you can engineer the halo rather than hope for it. If emotional warmth drives mental availability, a campaign built around emotional warmth is also doing work on availability - without a separate brief. The model shows which combinations are worth designing for.
You can use existing equity to build new perceptions. A brand with high trust but low modernity does not have to build modernity from scratch. If the model shows trust and modernity are causally connected in your category - because consumers who rate the brand highly on trust also tend to move on modernity - then reinforcing trust creates the conditions for modernity to follow. You are building along a pathway that already exists in how consumers think about your brand, not creating one from nothing.
Tracker only
Find the weakest scores. Brief the agency to close the gaps. Commit the media budget. Measure tracker movement after the campaign. No prediction of commercial impact before spend.
Path model
Identify the perception clusters with the highest total effect on your target outcome. Simulate the commercial return of each option. Commit the budget to the highest-leverage lever - with a predicted return attached before a pound is spent.
That simulation becomes the brief. It also becomes the success metric. After 12 months, you can validate whether the predicted shift occurred - not just whether the campaign ran. This is the difference between brand investment and brand spend.
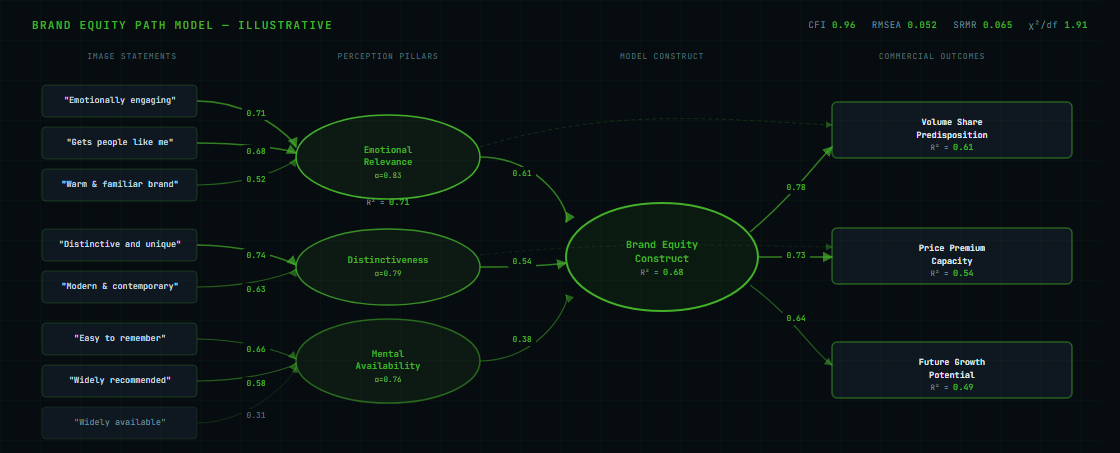
The Architecture of a Brand Equity Path Model
A path analysis model for brand equity is built in three layers. Each layer has a specific job.
Image Statements (Inputs)
Individual brand perception items from the tracker survey: "modern and contemporary," "high quality," "a brand I trust," "innovative," "good value." These are the raw building blocks - observed variables measured directly.
Perception Pillars (Constructs)
Image statements are grouped into broader themes using factor analysis - typically three to five pillars that each capture a coherent dimension of brand equity. The statements drive the pillar, not the other way around - this preserves causal direction.
Commercial Outcomes
The dependent variables: volume share predisposition (propensity to buy), price premium capacity (willingness to pay above average), and future growth potential. These are what the pillars drive - and the only things that justify the marketing investment.
The numbers on the arrows are standardised path coefficients - they show the relative strength of each relationship on a comparable scale, so you can rank the drivers directly. A higher coefficient means a stronger effect on the outcome, independent of how the underlying variables are measured. The coefficients in the final model have been tested for reliability by re-running the model across hundreds of random subsamples to confirm each link is real and holds consistently. Those are the numbers that justify brand investment decisions.
Why Total Effect Changes the Prioritisation
The most important output of a path model is not the direct effect between any two nodes. It is the total effect - which includes every indirect pathway through which one variable influences another.
A perception pillar influences a commercial outcome through its own direct path and through every intermediary pillar it moves along the way. Total Effect = Direct effect + (sum of all indirect effects).
Example: Pillar A has a direct path to volume share of 0.32. It also moves Pillar B (coefficient 0.41), which has its own direct path to volume share (0.29). Indirect effect: 0.41 × 0.29 = 0.12. Total effect: 0.32 + 0.12 = 0.44. A pillar that looks moderate on direct effect alone becomes the most important driver in the model once indirect routes are counted.
A pillar that appears moderately important from its direct effect alone can be the most important driver in the model once indirect effects are included. Optimising for direct effects only - which is what any simple regression approach will do - systematically undervalues the highest-leverage brand investments.
What Path Coefficients Look Like in Practice
These patterns are illustrative, derived from brand equity studies across FMCG and financial services categories. They are not universal - every category has its own causal structure, which is why building the model for your specific brand and category is the work.
Mental availability typically carries the lowest path coefficient to price premium capacity - a brand investing in broad awareness advertising to close a premium gap is solving the wrong problem. Premium is built almost entirely through emotional relevance and distinctiveness. The path model makes this explicit before the media budget is committed - not after the campaign produces no pricing headroom.
The Annual Brief Problem
Without a causal model, the annual brand communication brief is written from a tracker dashboard filtered through internal opinion. This produces a brief that tries to be "more relevant, more distinctive, and more visible simultaneously" - which is not a brief. It is a wish list. And it changes direction every time the tracker wave shifts.
The path model solves this in two ways. First, it identifies the one or two perception pillars with the highest total effect on your target commercial outcome - so the brief has a clear focus that does not change quarterly. Second, it gives that brief a predicted commercial return: the simulator output in the language of the outcome variable. That prediction becomes the success metric before the campaign begins, not a post-rationalisation after it ends.
A brand communication strategy built on a path model holds across multiple campaign cycles. It does not need to be rewritten every time a tracker wave shows a two-point movement in an attribute that has near-zero causal weight.
Running Simulations: From Model to Brief
Once the causal structure is estimated and validated, the model becomes a simulator. This is where path analysis moves from research output to planning tool.
The simulator interface lets you set a target change in the endorsement rate of a perception cluster - the percentage of your audience agreeing with the underlying image statements - and see what the model predicts for your chosen commercial outcome. The standard approach uses two scenarios run on each cluster in turn: a starter scenario (+3 percentage points endorsement) and a stretch scenario (+5 percentage points). Running both across all clusters produces a ranked comparison of commercial headroom by driver.
-
Choose the outcome to optimise forVolume share predisposition, price premium capacity, and future growth potential have different driver profiles. The simulation is run separately for each. A perception cluster that is the top lever on volume may have weak contribution to premium - which is why channel and message strategy should follow the model, not precede it.
-
Set the input scenariosThe standard starter scenarios are +3 percentage points in endorsement (average) and +5 percentage points (stretch). These are the inputs to explore: not campaign targets, but probes for where the model has the most headroom. The simulator runs both across every perception cluster in the model.
-
Indicator co-movement within the constructThe simulator does not move a single image statement in isolation. Statements within the same factor co-move based on their cross-correlations with the target statement - the historically observed co-variance estimated from the tracker data. If "emotionally engaging" increases by 5 points in endorsement, "warm and familiar brand" increases by a proportionate amount. This is the "correlation-linked" stage of the simulation: it operates at the indicator level, within a single construct, and prevents artificially inflating a factor by moving only its highest-loading statement.
-
Propagation through the structural model via regressionOnce the updated indicator endorsements are set, the simulator calculates the new construct score using each statement's outer weight - its standardised coefficient into the pillar it defines. That new pillar score is then pushed through the structural paths between constructs using the regression coefficients (beta values) estimated by the PLS algorithm. This stage is regression, not correlation: each structural path is a separate linear regression between constructs. The final output is the predicted change in the outcome variable - direct and indirect effects compounded through every causal path in the network.
-
Rank and commitThe output is a ranked table: each perception cluster, the predicted commercial shift for the starter and stretch scenario, and its current score. The highest-leverage clusters - those producing the largest predicted shift per unit of endorsement movement - become the brief. The brief then has a specific predicted commercial return that can be tracked against actual tracker movement after 12 months.
From Simulation to Media and Creative Brief
The simulation output connects directly to channel strategy, not just message strategy.
Volume Path Attributes
High-leverage attributes on the volume share path determine core message and broad reach channels. These are the perceptions that, when moved, predict the largest shift in purchase predisposition. Reach and frequency over emotional depth.
Premium Path Attributes
High-leverage attributes on the price premium path determine tone, context, and environment. Premium equity is built through distinctiveness and emotional relevance - requiring depth of engagement over reach, and premium editorial context over mass channels.
Growth Path Attributes
Attributes important for future growth potential determine where to invest for the next three to five years. These are typically emerging perceptions with lower current scores but strong causal weight on long-term predisposition - the investment that looks early but builds durable equity.
This is how the path model turns brand analysis into a media plan. The model output answers not just "what should we say" but "where should we say it and with what depth of engagement."
What the Model Requires
Data: Minimum 6 waves of brand tracker data with consistent image statement batteries. The model runs on respondent-level data pooled across waves - not wave averages - which is what allows it to map how individual perceptions relate to each other and to commercial outcomes. Six waves at 250-300 respondents per wave gives a working sample of 1,500-1,800 individual data points. The model can be built from existing tracker data if the questionnaire is structured correctly - no new fieldwork required in most cases.
Timing: Model build takes 4-6 weeks from clean data to simulation-ready output. Annual refresh recommended to detect structural shifts in the category's causal model - which do occur when category disruption changes consumer decision logic.
Output format: The model is delivered as a working simulator with a prioritised attribute investment map, not a static report. Brand teams use it directly in planning cycles to evaluate communication briefs and budget allocation options.
From Model to Communication Strategy
The practical output of path analysis is a communication brief with a financial justification - and a strategy that holds across planning cycles rather than being rewritten from the most recent tracker wave.
Without the causal model, the annual brief is written from a dashboard filtered through internal opinion. The result is typically a brief that tries to move everything simultaneously, because no one can demonstrate which attribute is most important. With the model, the choice is explicit, the trade-off is quantified, and the success metric is set before the campaign begins.
That is the difference between understanding brand equity and tracking it.
At Lift-Off Consulting, brand equity path analysis is how we set communication priorities and evaluate brand investment decisions for CPG and FMCG clients. Combined with demand space segmentation, it answers both where a brand should play and what it needs to say to win there. NavigatorLab brings this methodology to brand teams as a working platform - not a one-off study. Get in touch to see how a path model maps your brand's equity structure and what it predicts for your next planning cycle.