

TL;DR A path model on tracker data shows which perceptions drive volume, premium and growth, and by how much.
- Weak tracker scores can have near-zero effect on volume, premium or growth, so a brief written to close the weakest scores can miss the drivers.
- Path analysis maps which perceptions drive commercial outcomes. It uses pooled respondent-level data across tracker waves, so it can show how individual perceptions relate to each other.
- Total effect matters more than direct effect. A perception pillar that looks moderate in isolation can be the most powerful driver once indirect routes through other pillars are counted.
- The output is a simulator: rank your levers by predicted effect on the target outcome before budget is committed, then validate after 12 months.
- Understanding causality also enables deliberate halo effects, designing campaigns to move multiple perceptions at once, and using existing strong equity to build new adjacent perceptions.
A quarterly tracker review typically produces a set of small score changes (quality up two points, consideration flat, trust up three) and a discussion that generates hypotheses with no way to choose between them, and no basis for deciding where the next budget cycle should go.
Tracker scores describe your position without explaining the causal structure underneath it. Without that structure, each quarterly review produces hypotheses the data cannot rank, and the team acts on one of them.
The Limits of Tracking Without Causality
A brand tracker gives you scores. It tells you where you stand on quality, trust, modernity, and value for money, and how those compare to competitors and to last quarter. It does not show how those perceptions relate to each other, or to volume, premium and growth. This article assumes you already know the concept; for the definitions, start with our explainer on what brand equity is and how it is measured.
A two-point shift on a monthly tracker wave of 250-300 respondents is within the margin of error. Teams spend significant budget (agency fees, tracker subscriptions, reporting time) to monitor changes that are, in most quarters, statistical noise. The movements get presented in reviews and discussed in planning sessions. Even when a score change is real, a tracker without a structural model cannot tell you whether it caused anything downstream.
When quality rises 3 points, the tracker cannot tell you whether that improved consideration, supported price premium, or moved alongside trust or independently of it. Without a model of how brand perceptions interrelate and connect to commercial outcomes, you cannot answer any of those questions from the data.
The Fix-the-Gaps Instinct
The most expensive consequence of tracking without causality is systematic investment in the wrong attributes.
Without a causal model, brand teams tend to fix the weaknesses, which is understandable. If quality scores 48 and competitors average 62, the brief is a mandate to build quality perceptions. The team buys media, produces creative and delivers campaigns. Two years later quality is at 54, consideration has not moved, premium pricing is still challenged, and the investment has not delivered.
Suppose a mid-sized FMCG brand has spent three campaign cycles on "modern and contemporary" and "high quality", both attributes where it indexes weakly against the category leader. A path model on its tracker data might put the combined total effect of the two statements on quality and modernity at about 0.11 on volume share predisposition, and that of emotional warmth, familiarity and "a brand that gets people like me" at about 0.54. In that case the brand has spent three cycles on the attributes with the least effect on volume, on the assumption that closing a gap on a weak score would move a commercial outcome.
The mistake in this example is reading each score on its own. The path model estimates how much each perception contributes to volume, premium and growth, and a score sets a priority only when it is read against that estimate. A weak score on a perception with a large total effect is where the model predicts the largest commercial return from closing the gap. A weak score on a perception with a small total effect can improve with no commercial effect. A brief written from scores alone cannot tell these two cases apart.
The solution is understanding causality: which perceptions drive commercial outcomes, with what coefficient, and through which pathways.
Established Brand Equity Models
Two frameworks supply the shared language many brand teams use for equity: Keller's customer-based brand equity pyramid and Aaker's brand equity dimensions. Both models do the jobs they were built for. Neither model weights the perceptions or links them to volume, premium or growth.
Keller's Customer-Based Brand Equity Pyramid
Keller's model orders equity as a construction sequence with four levels: salience at the base, performance and imagery above it, judgements and feelings above those, and resonance at the top, in Keller's own labels awareness, meaning, response and relationship. Its job is organising qualitative understanding of how equity builds, and it gives a brand team a shared language for where their brand stands in the sequence. The pyramid orders the layers without weighting them: it has no coefficients, no category-specific structure, and no link from any layer to volume, premium or growth.
Aaker's Brand Equity Dimensions
Aaker's model inventories equity as five assets: brand loyalty, name awareness, perceived quality, brand associations, and other proprietary assets such as trademarks and channel relationships. It reads as an audit of the forms equity can take, which makes it useful for structuring a measurement programme and for valuation conversations. It is a taxonomy: it says what to measure, and it does not say which dimension drives your category's commercial outcomes.
Adding weights and outcome links to Keller and Aaker
The frameworks and the path model do different jobs, and the path model depends on the frameworks having done theirs. The image statement battery in any decent tracker is descended from exactly this thinking: the statements measure the associations, quality perceptions and loyalty signals the two models name. The path model takes those measured perceptions and adds the layer both frameworks leave open - estimated, significance-tested paths from each perception pillar to volume, premium and growth in your specific category, with an effect on each outcome that can be ranked and simulated. Building and checking that model has historically been a slow expert project; how an AI copilot on a validated engine changes the time and cost involved is covered in our piece on causal brand equity modelling with an AI copilot.
Planning with a causal model
Most brand teams enter a planning cycle knowing where their brand stands. A path model adds the drivers, their weights and their routes. The consequences for planning follow.
You can identify the levers before committing to a direction. Suppose the simulation shows that a 5-point rise in endorsement of the emotional relevance pillar predicts a larger lift in volume share predisposition than the same rise in the distinctiveness pillar. You see this before a brief is written. The simulation ranks the perception pillars by predicted effect; the decision on the brief remains with the team.
You can design for the halo effect deliberately. A campaign or product launch moves every perception causally connected to the one it targets. If emotional warmth drives mental availability, a campaign centred on emotional warmth is also doing work on availability, without a separate brief. The model shows which combinations are worth designing for.
You can use existing equity to build new perceptions. A brand with high trust but low modernity does not have to build modernity from scratch. If the model shows a significant path from trust to modernity in your category, then reinforcing trust is predicted to lift modernity as well.
Tracker only
Find the weakest scores, brief the agency to close the gaps, commit the media budget, and measure tracker movement after the campaign. There is no prediction of commercial impact before spend.
Path model
Identify the perception pillars with the highest total effect (direct and indirect) on your target outcome, simulate each option, and commit the budget to the strongest lever, with a predicted outcome attached before the budget is spent.
That simulation is the brief. It is also the success metric. After 12 months, you can validate whether the predicted shift occurred, and judge the campaign on the shift itself. Putting a money figure on that predicted shift is the next layer, covered in brand equity valuation; operating that conversion as a standing management routine on the finance calendar is covered in financial brand equity tracking; and the whole approach, with explicit drivers, explicit weights, and a check after the fact, is a marketing evaluation function applied to brand analytics.
The Structure of a Brand Equity Path Model
A path analysis model for brand equity is built in three layers.
Image Statements (Inputs)
Individual brand perception items from the tracker survey: "modern and contemporary," "high quality," "a brand I trust," "innovative," "good value." These are the raw inputs: observed variables measured directly.
Perception Pillars (Constructs)
Image statements are grouped into broader themes using factor analysis, typically three to five pillars that each capture a coherent dimension of brand equity. In the model, each pillar is a weighted composite of its statements.
Commercial Outcomes
The dependent variables: volume share predisposition (propensity to buy), price premium capacity (willingness to pay above average), and future growth potential (long-term predisposition). These are the outcomes the pillars drive, and the measures against which the marketing investment is judged.
In the path diagram (the figure under Path coefficients in practice, below), the numbers on the arrows are standardised path coefficients: they show the relative strength of each relationship on a comparable scale, so you can rank the drivers directly. A higher coefficient means a stronger effect on the outcome, independent of how the underlying variables are measured. We test each coefficient by re-estimating the model on hundreds of random subsamples (bootstrap testing) to check that it is stable across them.
Total Effect and Prioritisation
The most important output of a path model is the total effect, which includes every indirect pathway through which one variable influences another.
A perception pillar influences a commercial outcome through its own direct path and through every intermediary pillar it moves along the way. Total Effect = Direct effect + (sum of all indirect effects).
Example: Pillar A has a direct path to volume share of 0.32. It also moves Pillar B (coefficient 0.41), which has its own direct path to volume share (0.29). Indirect effect: 0.41 × 0.29 = 0.12. Total effect: 0.32 + 0.12 = 0.44. In this example the indirect route adds more than a third to the pillar's effect.
Ranking by total effect can change the order set by direct effect. Optimising for direct effects only - which is what any simple regression approach will do - systematically undervalues the brand investments with the largest total effect.
Path coefficients in practice
The figure and the box below are illustrative. They are not universal: every category has its own causal structure, which is why the model has to be built for your specific brand and category.
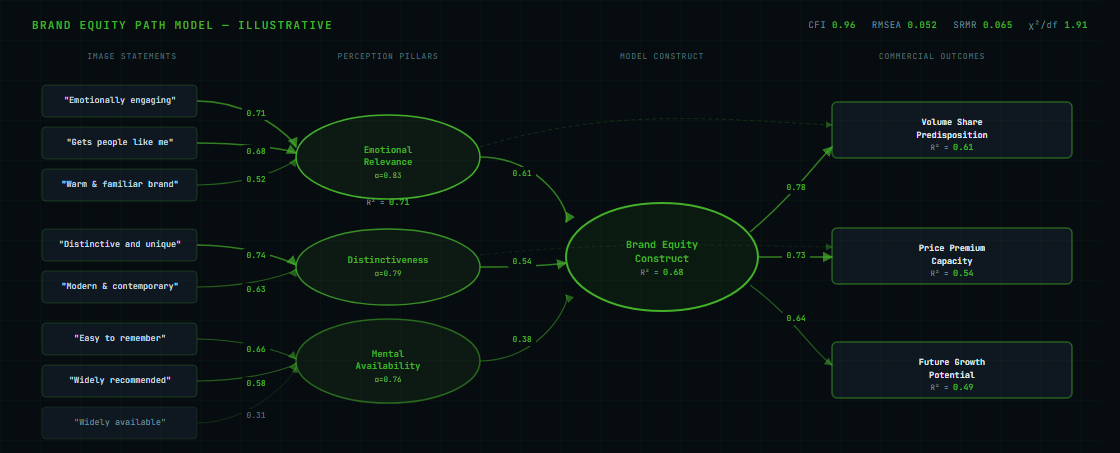
In the illustrative model, mental availability has the lowest path coefficient to price premium capacity, so broad awareness advertising would do little to close a premium gap. In this model, premium comes mainly from emotional relevance and distinctiveness. The path model makes this explicit before the media budget is committed.
The Annual Brief Problem
Without a causal model, the annual brand communication brief is written from a tracker dashboard filtered through internal opinion. This produces a brief that tries to be more relevant, more distinctive and more visible at the same time, and changes direction every time the tracker wave shifts.
The path model changes the brief in two ways. First, it identifies the one or two perception pillars with the highest total effect on your target commercial outcome, so the brief has a clear focus that does not change quarterly. Second, it gives that brief a predicted effect on the target outcome, taken from the simulator. That prediction is the success metric, set before the campaign begins.
A brand communication strategy built on a path model holds across campaign cycles, because a two-point wave movement in a low-weight attribute does not change the ranking.
Simulation steps
Once the causal structure is estimated and validated, the model acts as a simulator. Path analysis then moves from research output to planning tool.
The simulator interface lets you set a target change in the endorsement rate of a perception pillar (the percentage of your audience agreeing with the underlying image statements) and see what the model predicts for your chosen commercial outcome. Applying the same change to each perception pillar in turn ranks the drivers by predicted effect.
-
Choose the outcome to optimise forVolume share predisposition, price premium capacity, and future growth potential have different driver profiles. The simulation is run separately for each. A perception pillar that is the top lever on volume may contribute little to premium, so the brief differs by outcome.
-
Indicator co-movement within the constructThe simulator does not move a single image statement in isolation. Statements within the same pillar move together, based on how strongly each one has tracked with the target statement in the tracker data. If "emotionally engaging" increases by 5 points in endorsement, "warm and familiar brand" increases by a proportionate amount. This stage works within one pillar, and it stops a pillar score being inflated by moving only the statement with the largest weight.
-
Propagation through the structural model via regressionOnce the updated indicator endorsements are set, the simulator calculates the new construct score using each statement's outer weight: its standardised coefficient into the pillar it defines. That new pillar score is then pushed through the structural paths between constructs using the path coefficients estimated by PLS-SEM (partial least squares structural equation modelling). This stage is regression: each structural path is a separate linear regression between constructs. The final output is the predicted change in the outcome variable: direct and indirect effects compounded through every causal path in the network.
-
Rank and commitThe output is a ranked table: each perception pillar, the predicted commercial shift from the tested change, and its current score. The pillars producing the largest predicted shift per unit of endorsement movement form the brief. The brief then has a predicted shift in the outcome variable that can be checked against tracker movement after 12 months.
Channel and message implications
The simulation output informs channel strategy as well as message strategy.
Volume Path Attributes
The attributes with the largest total effect on the volume share path determine core message and broad reach channels. These are the perceptions that, when moved, predict the largest shift in purchase predisposition. The strategy favours reach and frequency over emotional depth.
Premium Path Attributes
Attributes with a large total effect on price premium set tone, context and environment, and call for depth of engagement ahead of reach.
Growth Path Attributes
Attributes important for future growth potential determine where to invest for later planning cycles. These may be perceptions with lower current scores and a strong path to future growth potential.
The model ranks the perceptions to move. Channel and depth of engagement follow from the type of perception, as a planning judgement outside the model.
Data requirements
Data: Minimum 6 waves of brand tracker data with consistent image statement batteries. The model is estimated on respondent-level data pooled across waves. Wave averages cannot show how individual perceptions relate to each other, and the pooled data can. Six waves at 250-300 respondents per wave gives a working sample of 1,500-1,800 individual data points. The model can be built from existing tracker data if the questionnaire is structured correctly, with no new fieldwork required in most cases.
Timing: Model build takes 4-6 weeks from clean data to simulation-ready output. An annual refresh is recommended to detect structural shifts in the category's causal model, which occur when category disruption changes how consumers decide.
Output format: The model is delivered as a working simulator with a prioritised attribute investment map. It is built for use in planning cycles, to evaluate communication briefs and budget allocation options.
Summary
The practical output of path analysis is a communication brief with a predicted effect on the outcome it targets, and a strategy that holds across planning cycles.
With the model, the choice of attribute is explicit, the trade-off is quantified, and the success metric is set before the campaign begins.
At Lift-Off Consulting, brand equity path analysis is how we set communication priorities and evaluate brand investment decisions for CPG and FMCG clients. Combined with demand space segmentation, it shows which demand spaces a brand should compete in and what it needs to say to win preference there. PathFinder is the platform that builds this model from tracker data and delivers the working simulator. PathFinder gives brand teams this methodology as a working platform for ongoing use, rather than a one-off study. Get in touch to see how a path model maps your brand's equity structure and what it predicts for your next planning cycle.