

VentureLab
Sizes market segments, then builds the long-term business model behind them: S-curve share capture, quarterly P&L, and returns, for B2B and B2C markets alike.
The problem
Market sizing usually lives in three disconnected artifacts. A TAM slide from a strategy deck. A spreadsheet of adoption assumptions built by one person. And a separate financial model that finance rebuilt from scratch because they did not trust the first two. If an assumption changes (target share, adoption speed, pricing) someone has to update all three by hand and hope they still agree.
That gap is the problem. The analysis is sound on the day it is presented and out of date by the next board cycle.
The build
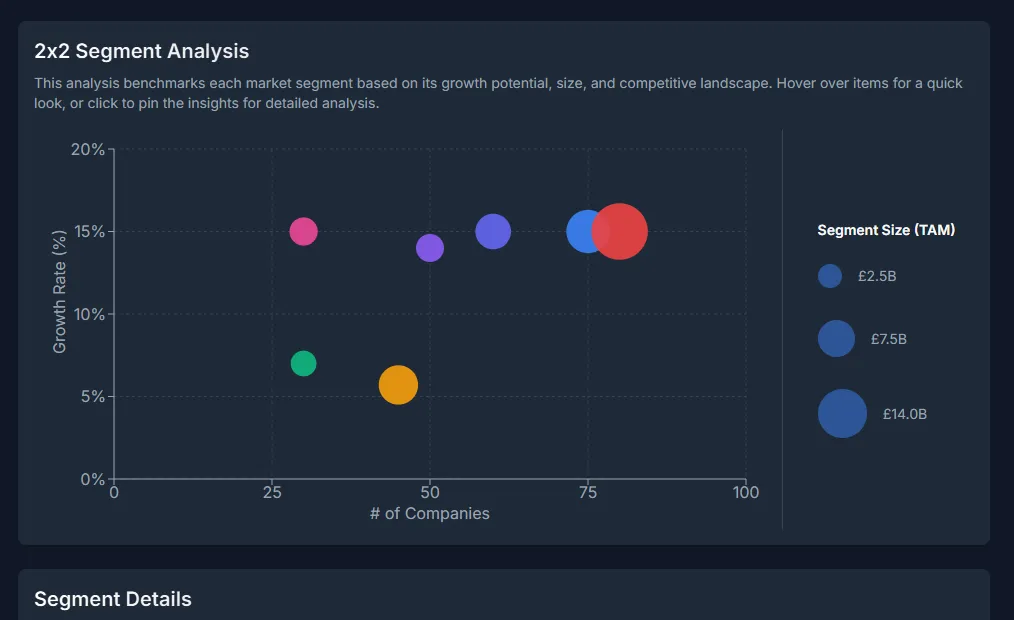
One application that holds the whole chain: segments, adoption, P&L, and returns. You define the market segments (B2B or B2C, with their size, growth, and buying behaviour) and VentureLab models adoption, P&L, and returns interactively.
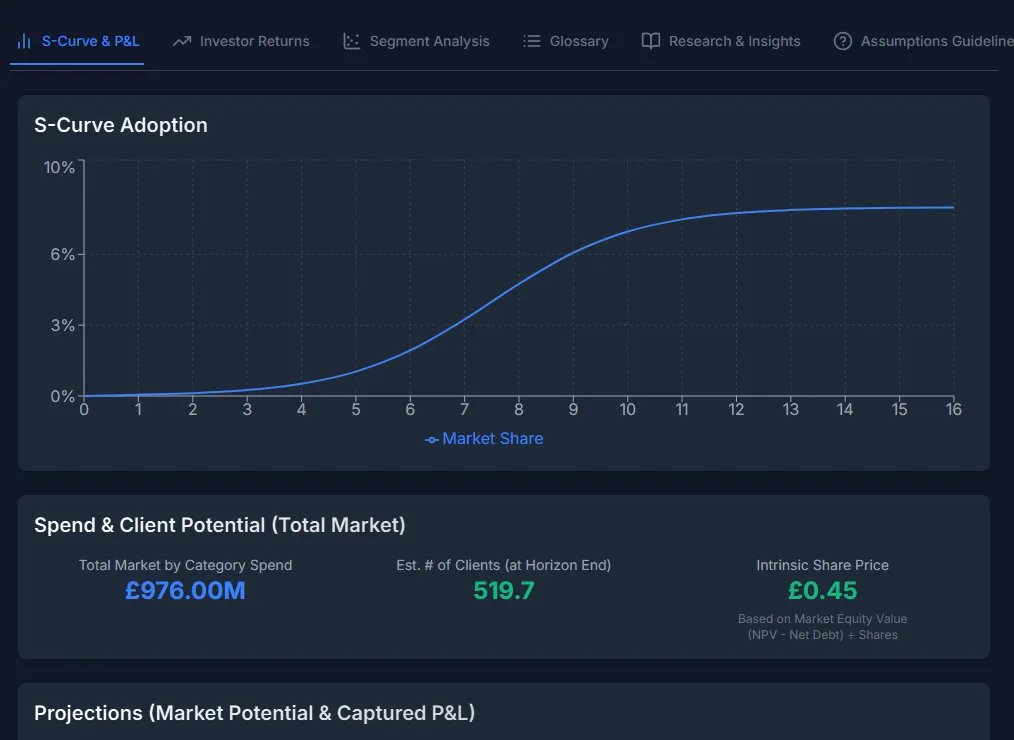
An S-curve engine models share capture per segment: target share, when fast growth starts, how long the takeover period runs, how steep the curve is. Every slider updates the quarterly projections live. The financial layer turns captured share into a P&L - revenue by quarter, cost assumptions, market potential against captured value.
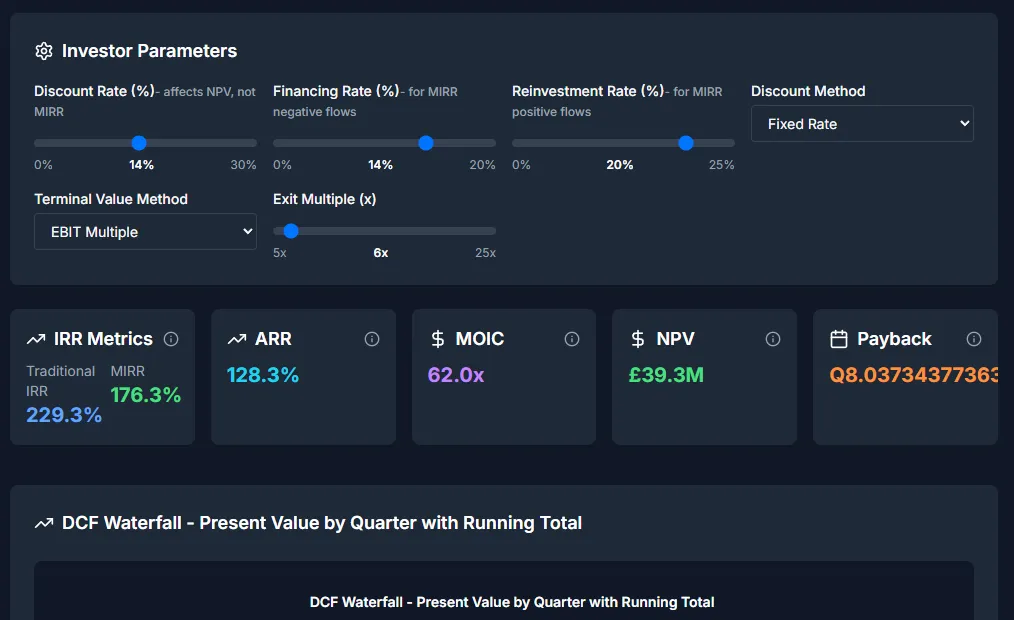
The investor view reads the same assumptions as a deal: IRR and MIRR, NPV at your discount rate, MOIC, payback period, and a DCF waterfall by quarter with running totals. Terminal value method and exit multiples are choices, so the model matches how your investors evaluate.
The model is data-driven. Swap the segment file and the same instrument analyses a different market, and it has been applied to B2B scale-up categories and consumer segments alike. Scenarios save and reload, and the model exports to a structured Excel workbook when the board wants the numbers in their own format.
The workflow
Everything downstream derives from one set of assumptions. Segments carry their own TAM, growth rate, and rationale. The S-curve controls are the strategic levers. The financial assumptions (revenue model, costs, WACC) appear alongside the strategic levers in the same view. Change any input and the P&L, the valuation, and the returns update together, because they are the same model.
The outcome
Sizing conversations now draw on the facts from marketing and finance. A stakeholder can challenge an assumption, you move the slider in the meeting, and everyone sees the effect in the P&L and the returns. Sizing and value come from the same model, so the gap between "how big is the opportunity" and "what is it worth to us" narrows.
Further reading
For where VentureLab sits in the wider picture, read The Shift From Advice to Decision-Making Systems.
A similar problem in your business
Tell us what your priorities are and we will tell you honestly whether we can help.
Get in touch